
How to Make a Scatter Plot in Excel – Step by Step Guide
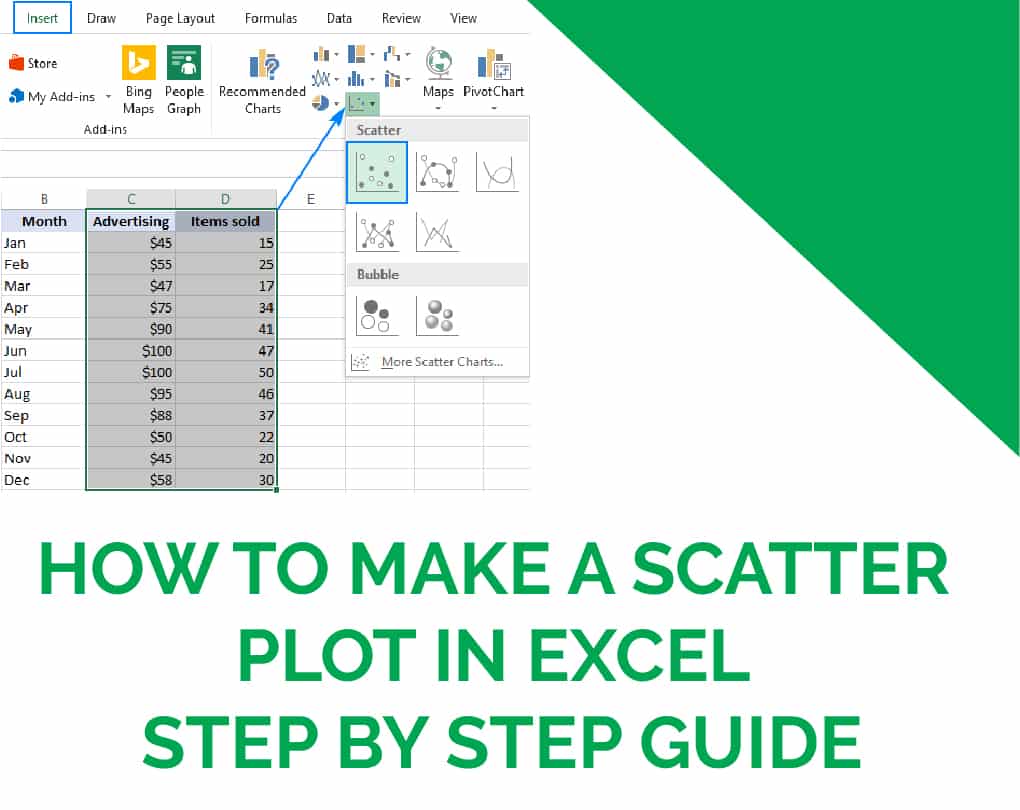
Curious to know how to make a scatter plot in excel? A Scatter graph is another word for the scatter plot, and they are related to line graphs. A scatter plot applies dots for the representation of data pieces. In contrast, line graphs use lines X and Y. Statistically, scatter plots are used to identify […]
Tagged How To Make A Scatter Plot In ExcelHow To Make A Scatter Plot In Excel With Multiple Data SetsHow To Make A Scatter Plot In Excel With Two Sets Of Data